A good net worth dashboard answers three questions at a glance: where you stand, what changed, and why. Here's what belongs on the screen, how to read it without overreacting, and the design details that separate a useful dashboard from a pretty one.
The best net worth dashboard app isn't the one with the nicest chart. It's the one where you can open it, look for thirty seconds, and know whether things are going the way you planned. That sounds simple, but a lot of dashboards fail it. They show one big number that bounces around with the stock market, a pie chart of account types you already knew, and very little about what you actually did this month.
This guide is about the dashboard itself: what should be on it, how to read each piece, a worked example of a monthly check, and the small design choices that make a dashboard trustworthy. Use it to judge any app, including Sumyfi, which we cover near the end.
What a good net worth dashboard shows first
A dashboard has limited space, and every widget competes for attention. These are the pieces that earn a spot on the first screen.
Notice what's missing: daily market moves. A dashboard that leads with today's portfolio change trains you to check it daily and react to noise. Net worth is a monthly number. The dashboard should treat it that way.
Net worth
one figure in one currency, with the date it was last updated
Assets and liabilities
the two totals side by side so you can see which side moved
Change since last review
monthly or since your last visit, not daily
Breakdown by type
cash, investments, property and debts, ideally with percentages
Liquid versus locked
how much you could reach in a week versus what's in retirement accounts or a house
Debt by interest rate
so a 22% credit card doesn't hide behind a 5% mortgage
How to read a net worth dashboard without overreacting
Every change in net worth comes from one of three places. Learning to tell them apart is most of the skill.
The first is what you did: money you saved, contributions to investments, and principal you paid down on loans. This is the part you control, and it should be fairly steady month to month.
The second is what markets did. If you hold investments, this will dominate some months. A 4% drop on a $90,000 portfolio is $3,600, which can make a month where you saved $1,500 look like a loss.
The third is revaluation: you updated your home value, your car lost value, or the exchange rate moved your US-dollar account. These are real but they're bookkeeping, not behavior.
A good dashboard makes it easy to separate those. A weak one just shows a number going up or down and leaves you to guess.
A monthly dashboard check, start to finish
Here's what reading a dashboard looks like for a made-up household. They open the app on the first of the month and see a net worth of $142,300, up $2,100 from last month.
Assets went from $498,900 to $500,400. Liabilities went from $358,700 to $358,100. So most of the gain came from the asset side, with a little from debt paydown.
Looking at the breakdown, cash is up $500 (normal saving, minus a couple of bigger bills), investments are up $1,000 (about $600 of contributions plus $400 from a decent market month), and the house value hasn't changed since they last updated it in the spring. On the debt side, the mortgage dropped $1,050 in principal but the credit card is up $450 because of a car repair.
So the honest read is: saving and debt paydown are on track, the market helped a bit, and one unplanned expense went on the credit card. The one action item is paying off that $450 before interest starts. That took about two minutes, and it's the whole point of a dashboard.
Three numbers worth glancing at besides the total
Ratios help when your net worth is dominated by one big thing, usually a house or a retirement account. You don't need many. These three cover most situations.
Months of cash
cash divided by monthly spending, a quick read on how long you could cover a job loss
High-interest debt share
credit cards and personal loans as a share of total debt, which you want heading toward zero
Liquid net worth
cash and non-retirement investments minus non-mortgage debt, closer to what you could actually use
Assets to liabilities
total assets divided by total debts, which should rise over time even when markets are flat
Signs a net worth dashboard is well built, or not
You can tell a lot about a dashboard from small things. A well-built one is honest about what it knows and what it doesn't.
Watch for balances that are quietly out of date. If a bank connection broke three weeks ago and the dashboard still counts that balance as current, your net worth is wrong and nothing tells you. Manual entries have the same risk: a car value you typed a year ago is probably too high now.
Watch for the opposite too: dashboards so full of scores, streaks and badges that the actual numbers get lost. A dashboard is a tool for a two-minute check, not a game.
Good sign
you can see which accounts are synced and which are entered by hand
Good sign
you can rearrange or hide sections you don't use
Good sign
multiple currencies are converted and labelled
Warning sign
no way to tell when a balance last updated
Warning sign
daily changes shown bigger than the monthly trend
Warning sign
debts hidden on a separate screen from assets
What the Sumyfi net worth dashboard shows
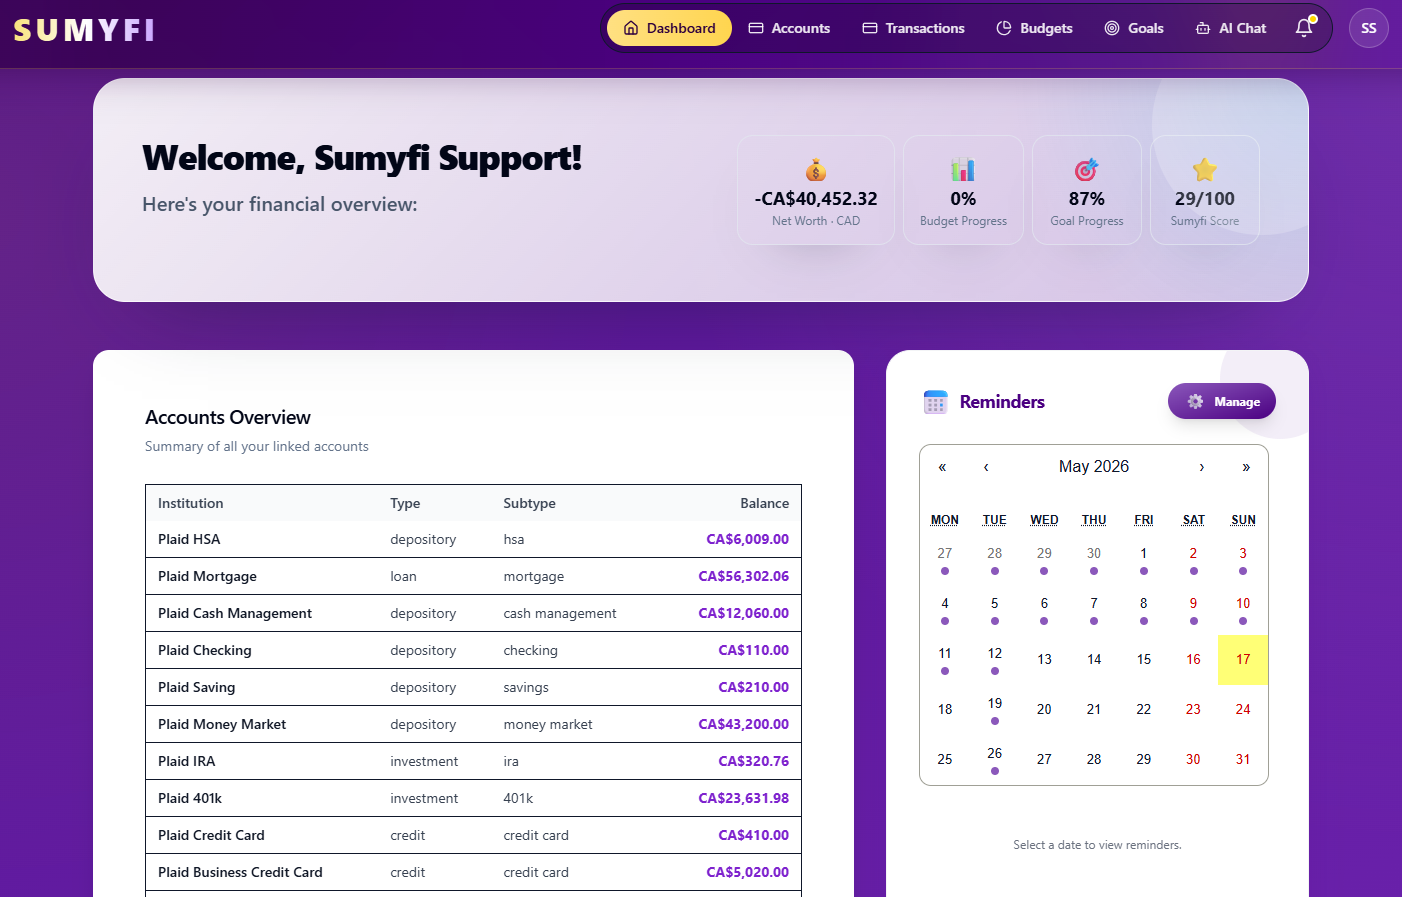
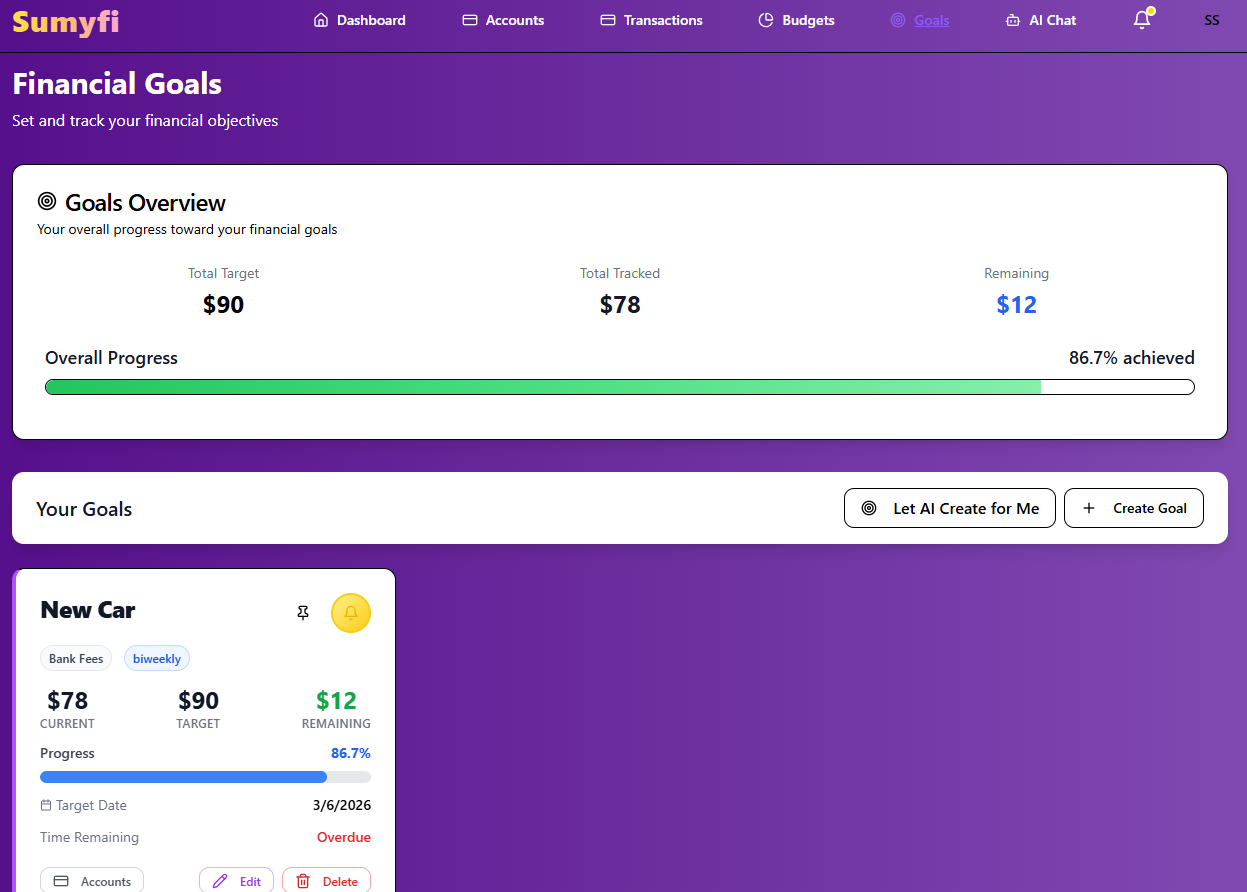
Sumyfi's main dashboard puts net worth next to budget progress, goal progress and the Sumyfi Score, so the monthly check covers what you own and what you're doing about it in one view. You can reorder dashboard sections and hide the ones you don't use. Net worth is shown in your base currency, with CAD and USD accounts converted.
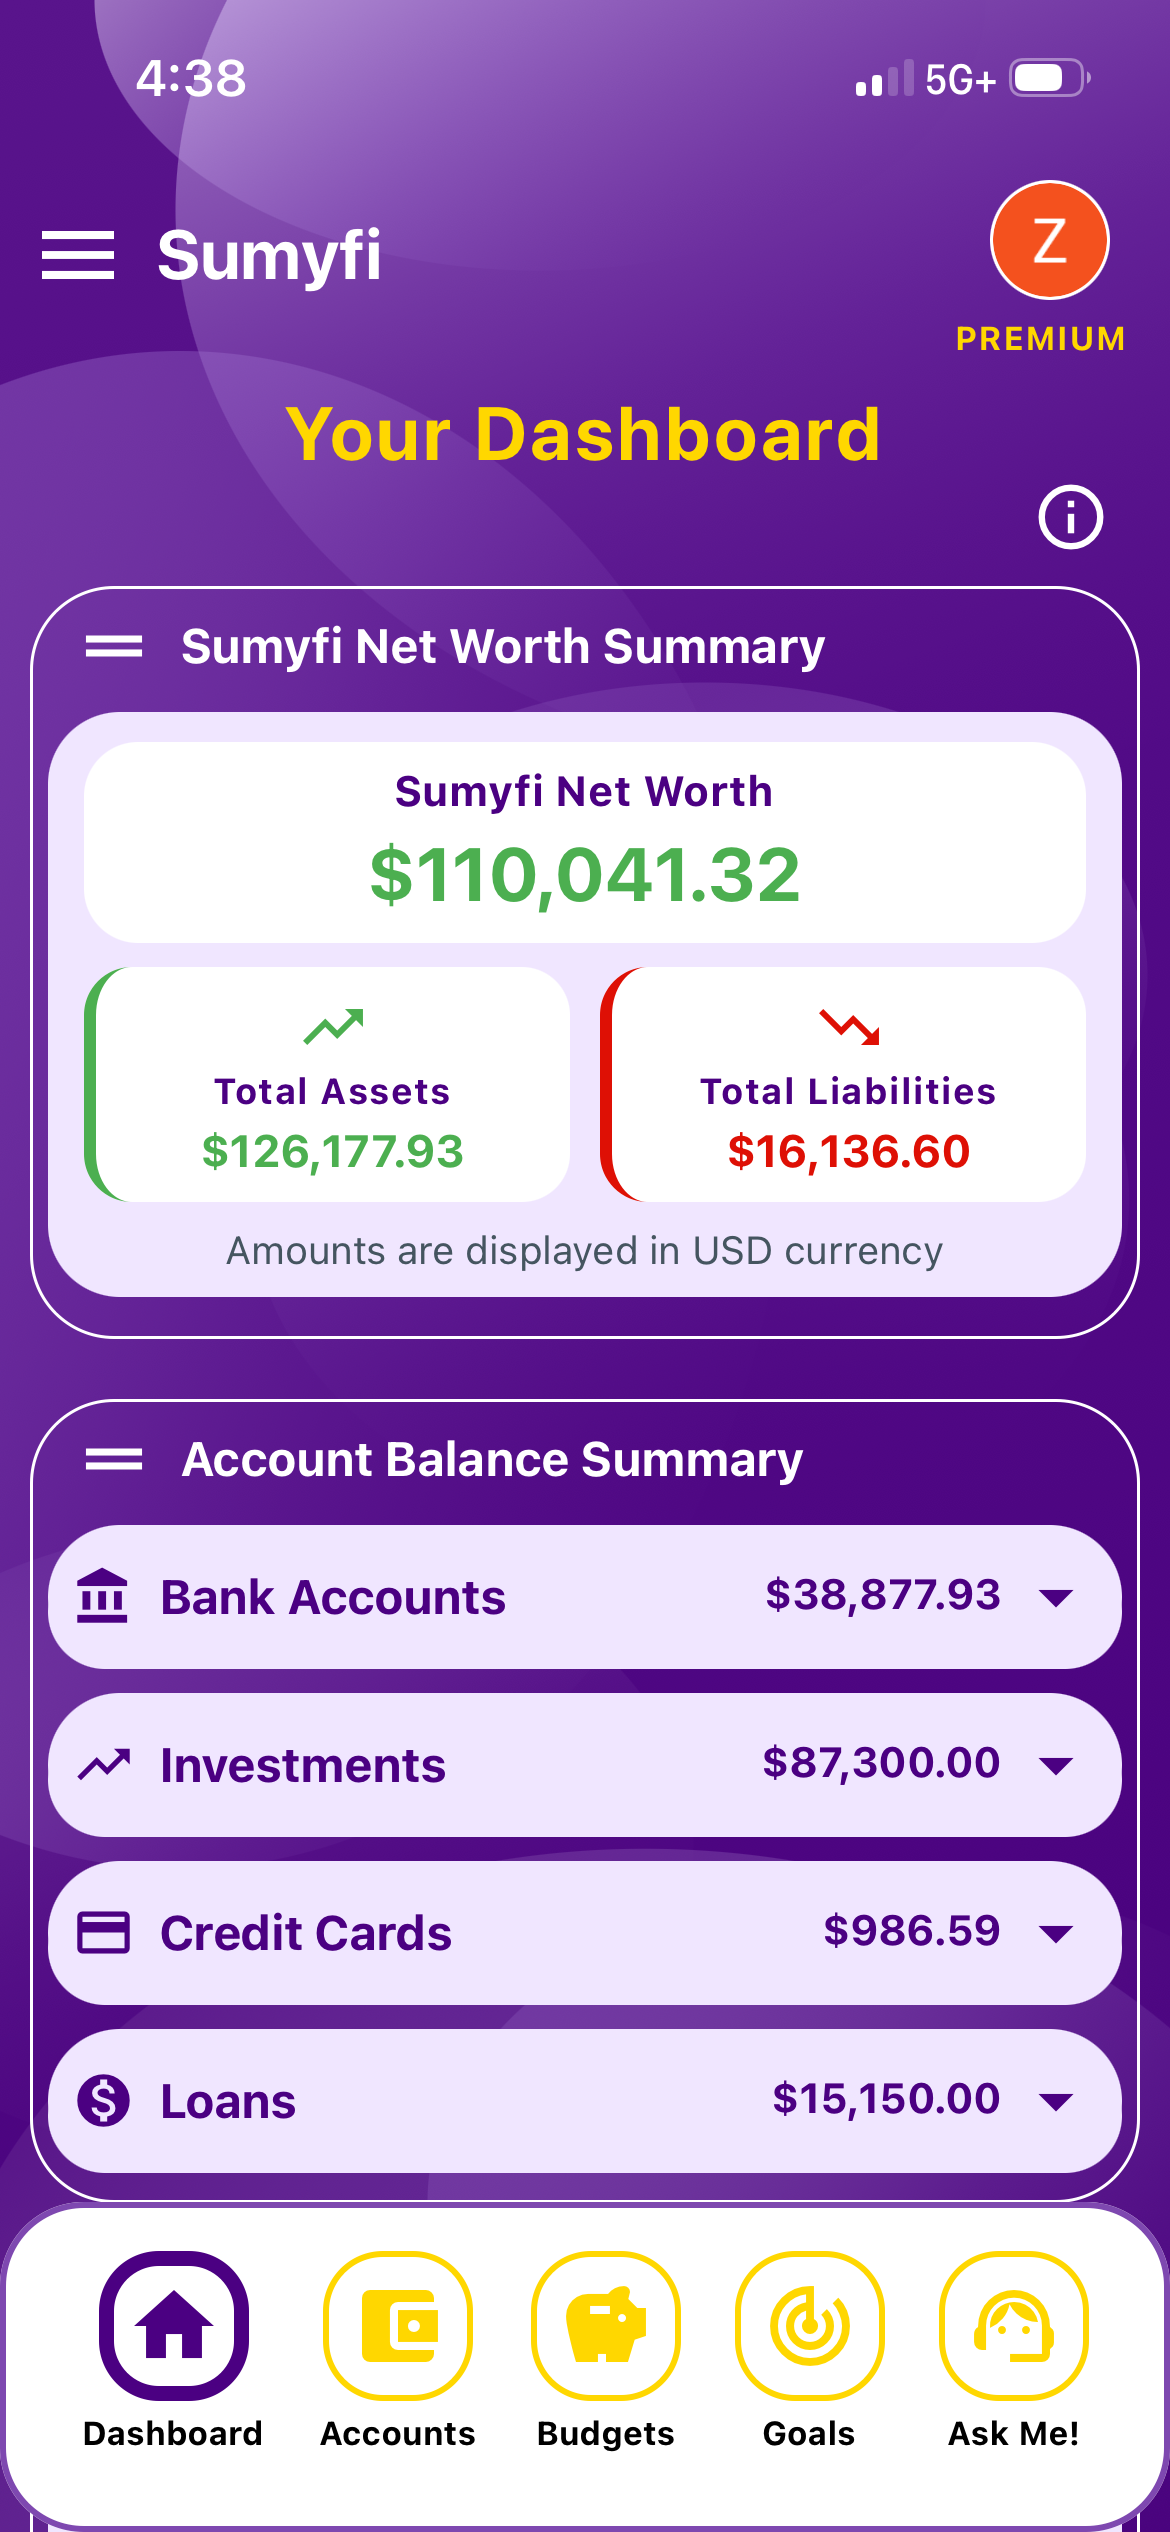
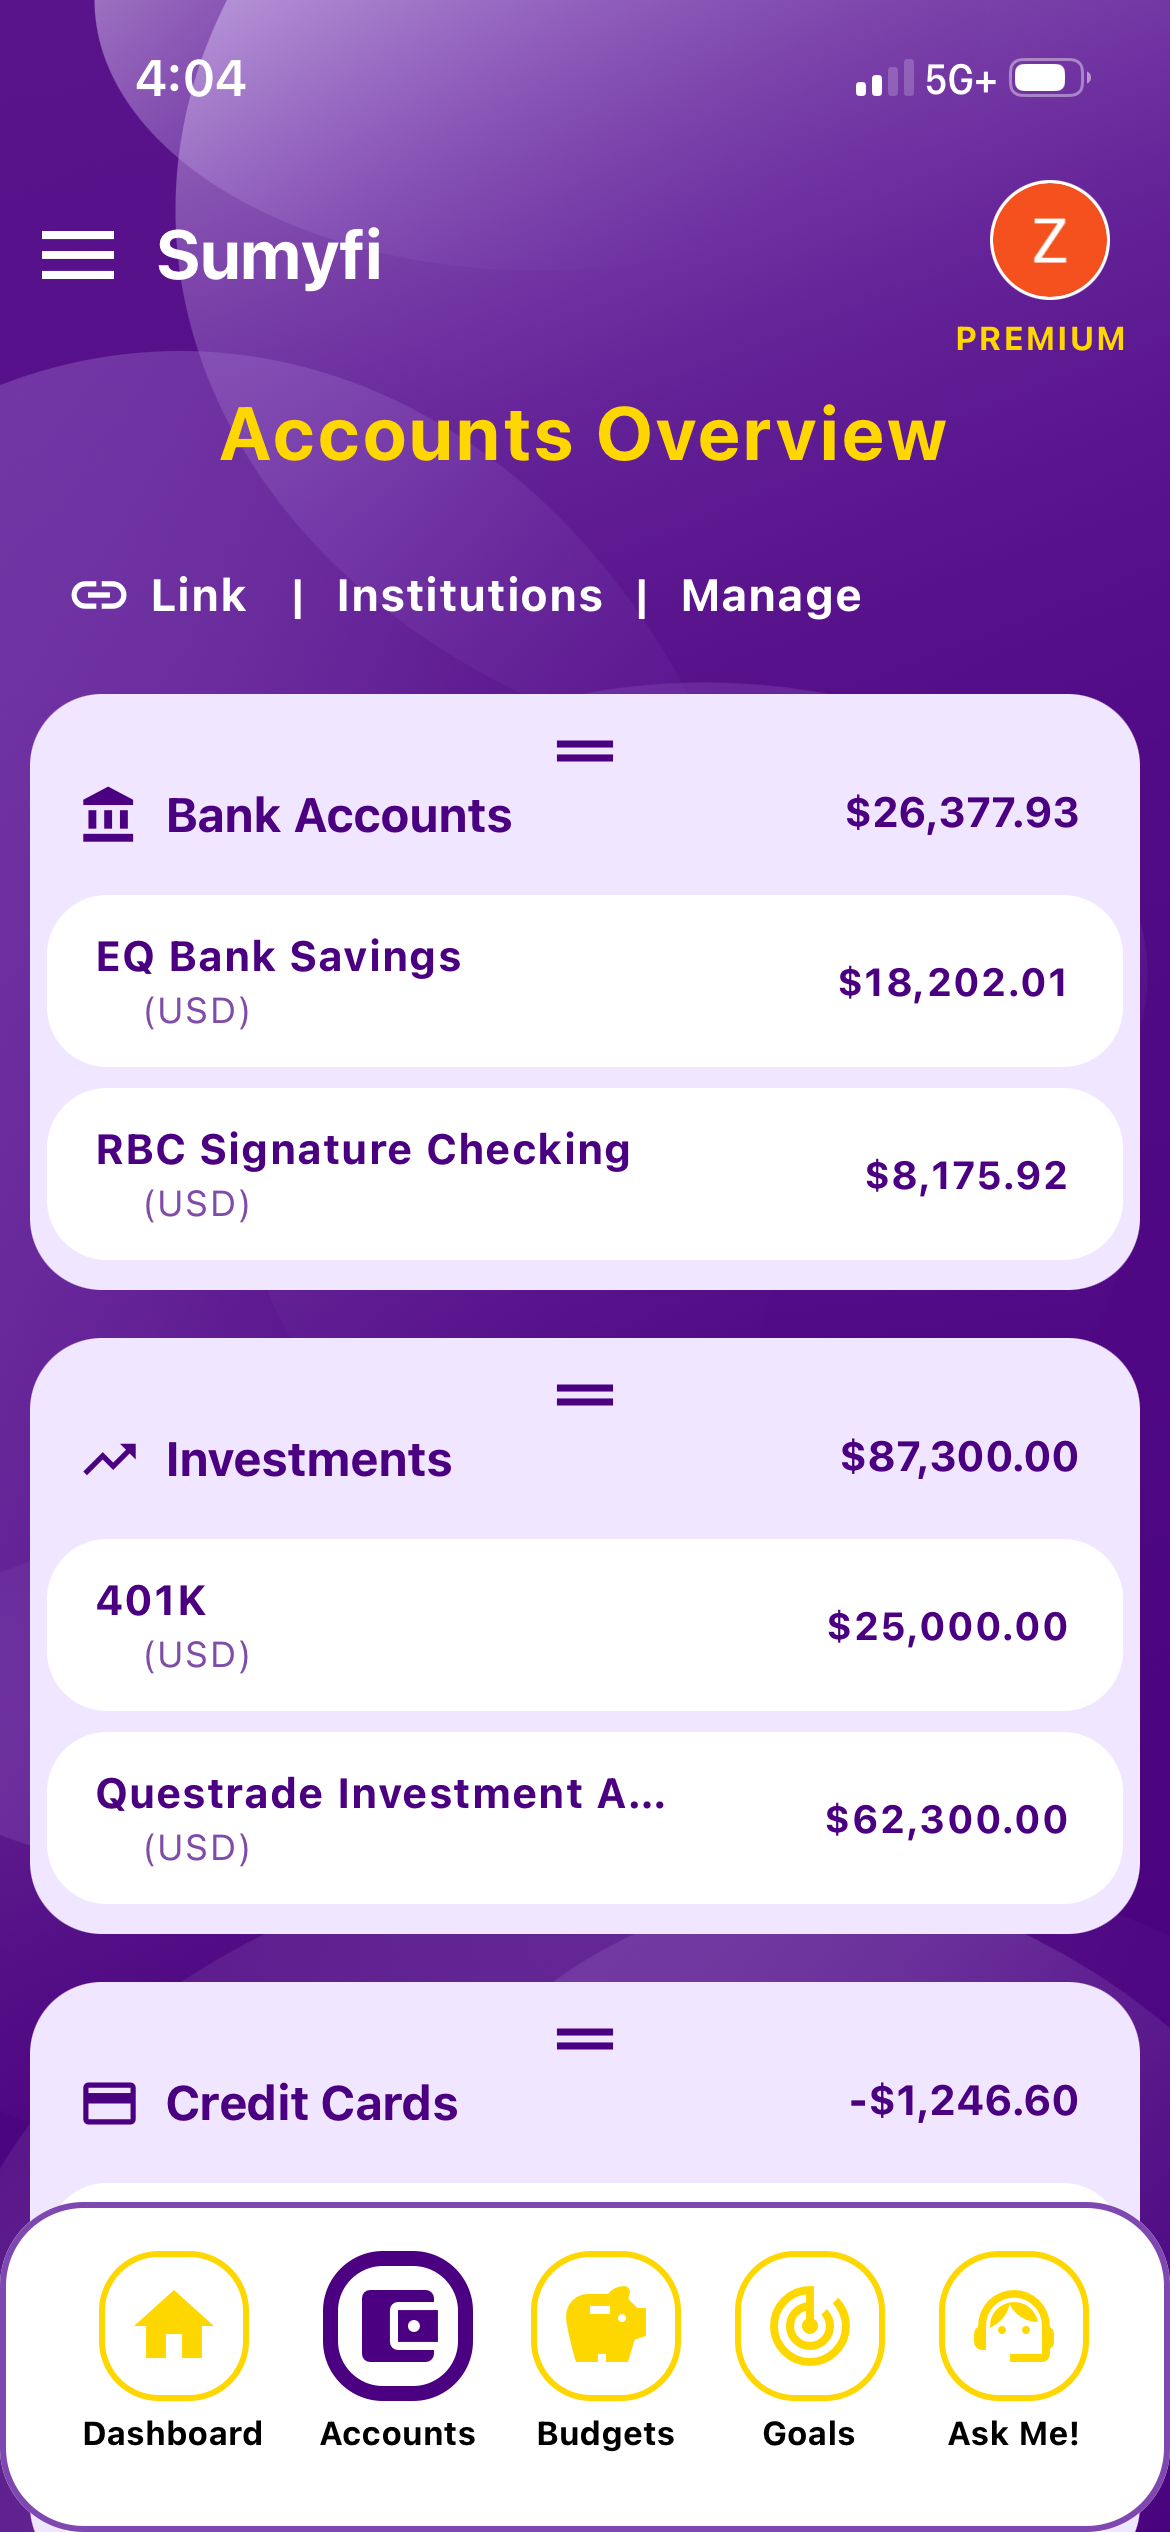
The accounts page goes a level deeper. It shows net worth, total assets, total liabilities, a breakdown by account type (bank accounts, investments, credit cards and loans) with each one's share, and an assets-to-liabilities ratio. Bank and investment accounts with positive balances count as assets. Credit cards and loans count as debts.
Accounts can sync automatically through Plaid in read-only mode on Premium, which has a 7-day free trial, or be added manually on the free plan. The dashboard doesn't value your home or car for you, and it isn't built for investment analysis. If you mostly want portfolio allocation and performance charts, an investment-focused dashboard is a better match.
Pros
- Net worth, budgets and goals on one screen
- Assets, liabilities and type breakdown on the accounts page
- CAD and USD converted to one base currency
Cons
- No portfolio allocation or performance charts
- No automatic property valuations